The Tool Box
Updated Dec 19th, 2024
Who is this guide for?
Case Management Supervisors, System Supervisors and Report Writers
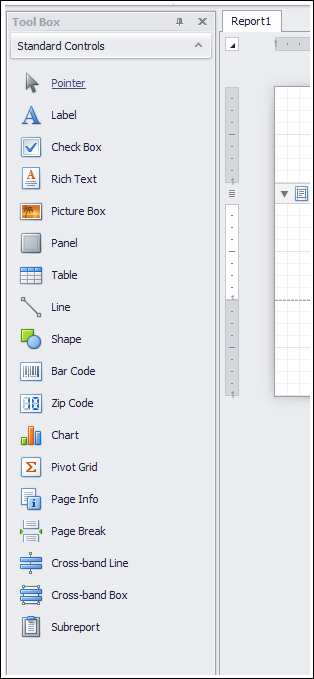
The Report Designer tool box contains useful objects which you can use to customise your reports. Click the links for more assistance on a particular option.
Tool Box Options
| Tool box item | Description |
|---|---|
| Pointer | Changes the mouse pointer back to a pointer after other tool box items have been used |
| Label | Inserts an editable text box |
| Check Box | Inserts a check box into your report |
| Rich Text | Similar to a label, except that you can include different fonts, sizes, colours etc. where label text can only be one particular defined font/colour |
| Picture Box | Insert a picture from your local PC or from a web address |
| Panel | Can be used to keep a set of report items together |
| Table | Insert a table into your report. Tables can include labels or fields |
| Line | Insert a formattable line into your report to break up sections |
| Shape | Insert a formattable shape into your report |
| Bar Code | Inserts a formattable bar code, which can be based on a field |
| Zip Code | Inserts a zip code box – only works with numbers |
| Chart | Insert a chart into your report based on the data exported |
| Pivot Grid | Insert a pivot table into your report |
| Page Info | Inserts “Page X of Y” information into your report |
| Page Break | Inserts a page break |
| Cross-band Line | Inserts a line which can span over more than one band, e.g. Page Header and Detail or Detail and Group Footer |
| Cross-band Box | Inserts a box which can span over more than one band, e.g. Page Header and Detail or Detail and Group Footer |
| Subreport | Not used |