Pivot Tables
Updated Dec 19th, 2024
Who is this guide for?
Case Management Supervisors and System Supervisors
This guide will take you through using pivot tables in your reports
You may wish to display totals for your reports in a pivot table to make them easier to read. The guide below shows a simple example to display the number of live matters each fee earner currently has for each work type, and is created using the standard Client and Matter Details view.
First, create your report as usual.
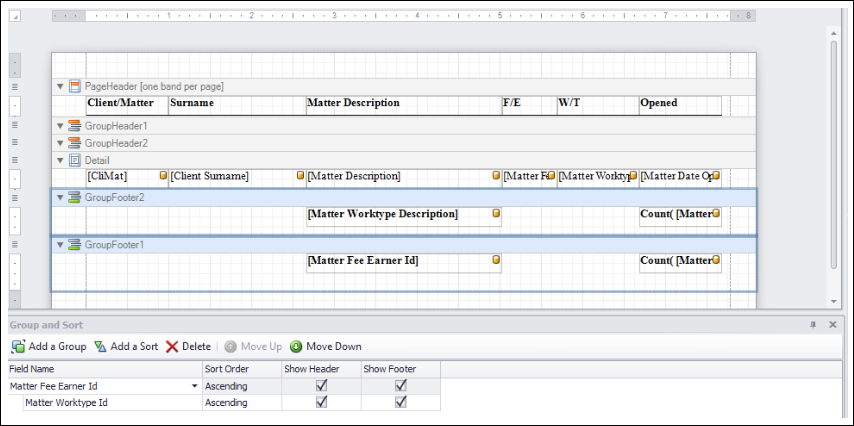
Create your Pivot Chart
Locate a sensible place to insert the pivot chart – the Report Header or Footer can be used for example. Drag in the Pivot Grid from the Toolbox on the left:
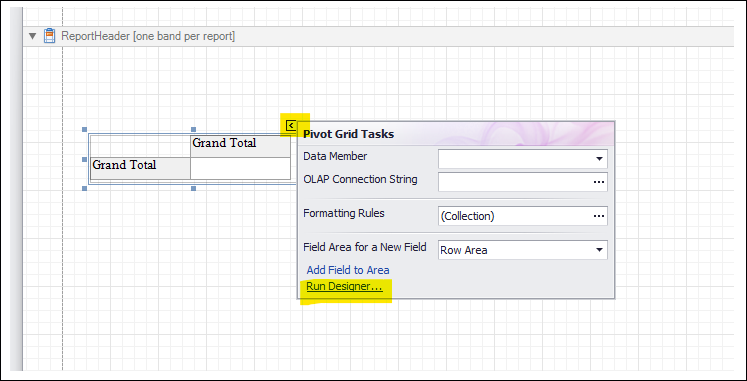
Select the chevron button in the top right corner of the pivot grid, and select Run Designer:
Double click the fields you want to add to your chart. In the example below, we have added the fee earner description, work type description, and the fee earner ID – the latter will be used as the data count:
Decide whether you want your fee earners or your work types in the rows or the columns, and set them as such, by selecting the field in the centre panel then choosing the area in the right hand panel. In the example below, we have set the fee earners to show along the top of the grid (Column Area), the work types to show down the side of the grid (Row area) and the matter fee earner ID as the Data Area to perform the counts:
Now, ensure that your Data Area field is set to the relevant summary type – in this example it will be a Count, as we wish to count the number of matters per work type/fee earner:
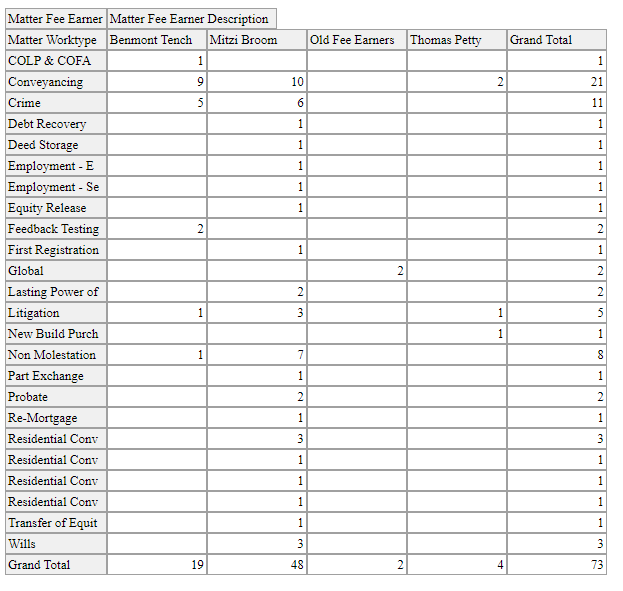
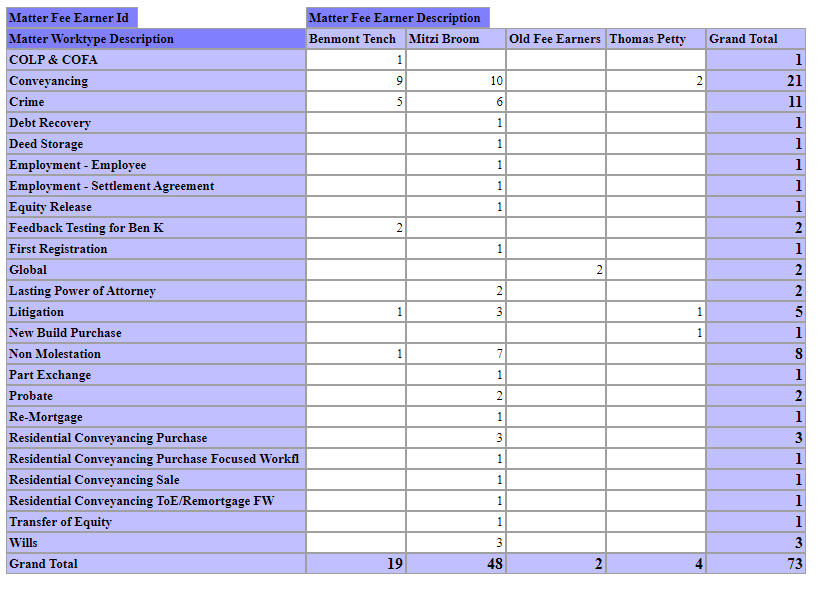
This is the base of your pivot table completed, and the resulting report should look something like this:
Changing and improving the layout
We can see that the work types don’t quite fit in the left hand column. Navigate back into the the pivot designer, select the work type column, and change the width to a larger size:
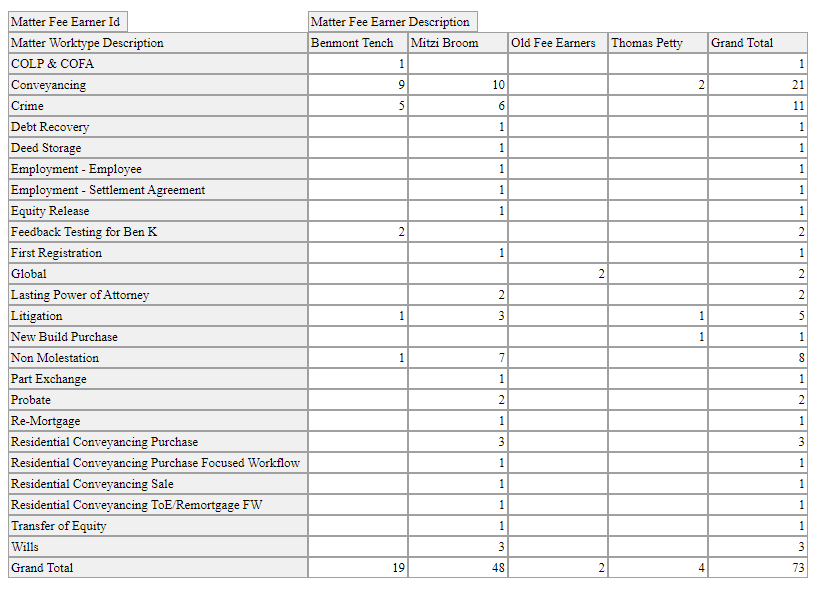
The work type description width now fits:
If you wish, you can change the colours, fonts etc. of the pivot using the Appearances menu in the Pivot Designer:
Example below:
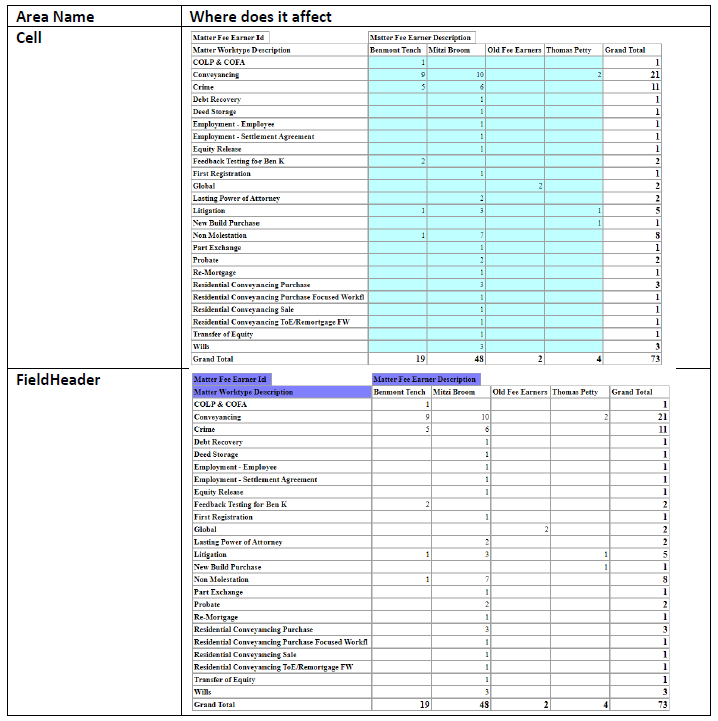
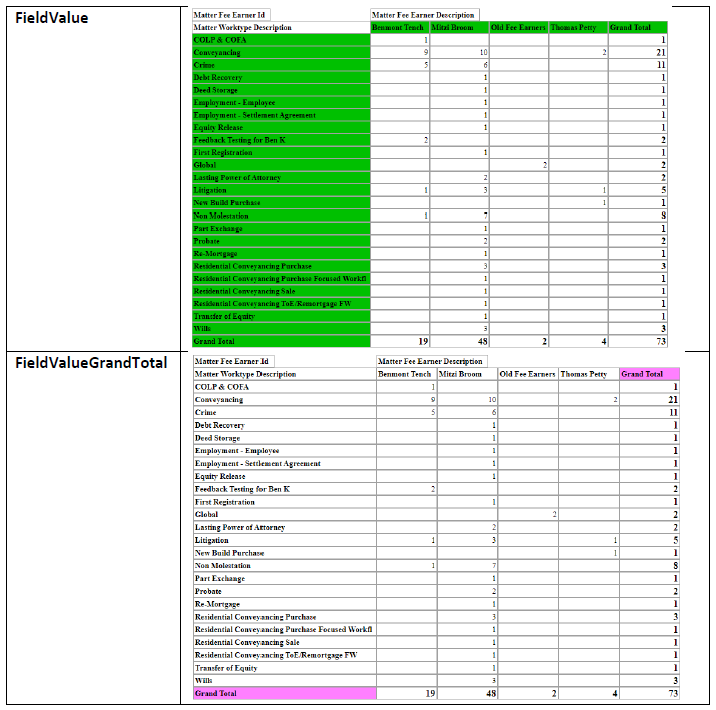
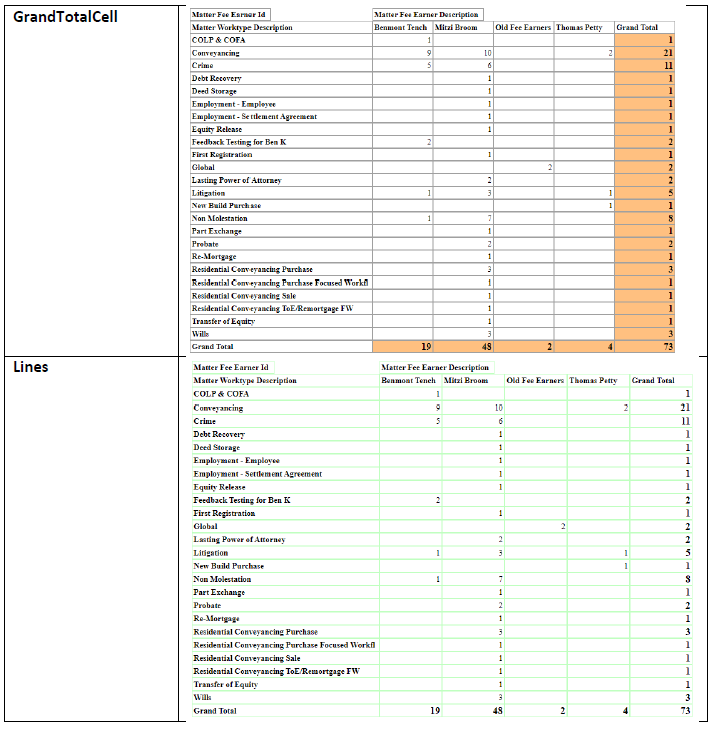
Appearance areas explained