Using Tables to Display Data
Updated Dec 19th, 2024
Who is this guide for?
Case Management Supervisors and System Supervisors
This guide will show you how to set up tables in the Report Writer
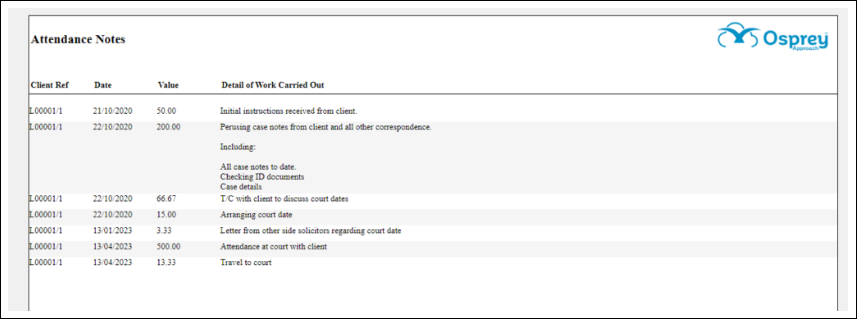
You can use a table to display data in your custom reports. This is useful where large data entries are to be displayed, such as time attendance notes. Using tables can make your report easier to read, and you can also set different highlights on alternate rows to enable a striped effect as shown below:
Insert your table
In the example below, we have created the basis of a time attendance note report.
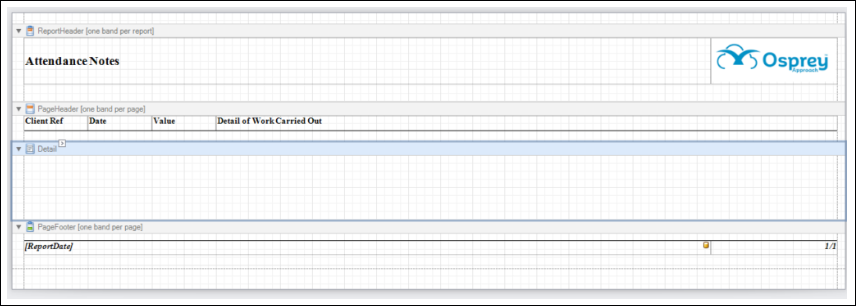
We will insert a table to the Detail section to display the data rows.
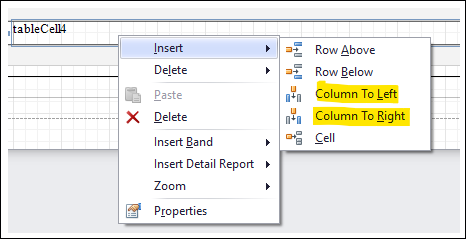
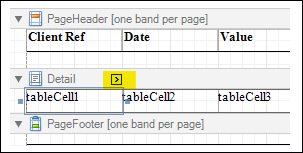
From the Tool Box on the left hand side of the report designer, click and drag the Table tool into the Detail line on your report. You can add more columns by right clicking on the table, selecting Insert > Columns to Left/Right.
You can then drag the table cells to match with your headings in the Page Header:
Inserting data into your table
We now need to insert the data into our table.
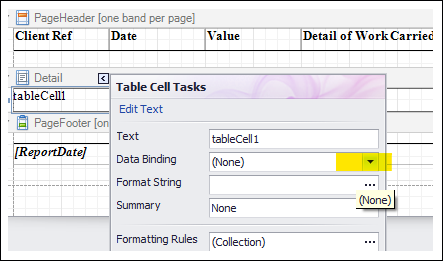
Click the first column of your table, and then the little chevron button which appears in the top right hand corner of the column:
From the menu, select Data Binding
Expand your data set name, and then choose the field you want to appear in this table column:
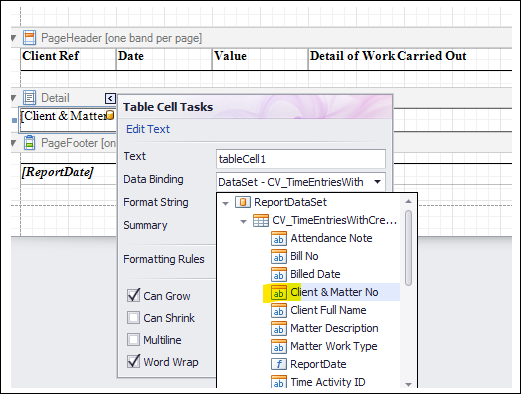
Continue until all table columns have been assigned. You can format the table cells in the same way as regular fields:
Adding alternate row highlights to your table
You can now add alternate row highlights if you wish.
- Select your table by hovering over it, and selecting the icon shown below:

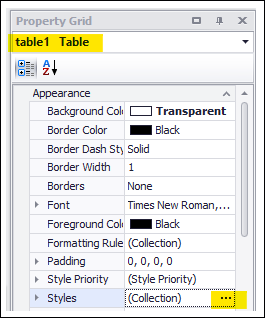
- In the Property Grid in the bottom right of the report designer, ensure your table is selected in the box at the top, and then navigate to the Style > Collection area:
- In the Styles Editor box, click Add
- In the right hand panel, select your background colour, then scroll down to name it in order to identify it later:
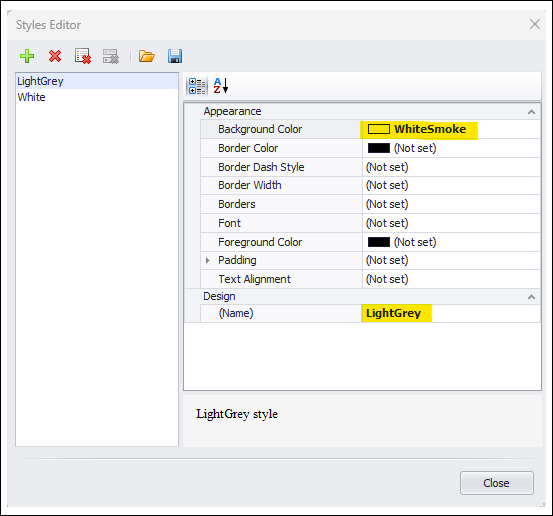
In the example above, we have added a light grey and a white style.
Now, we need to apply these styles to the table’s even and odd rows.
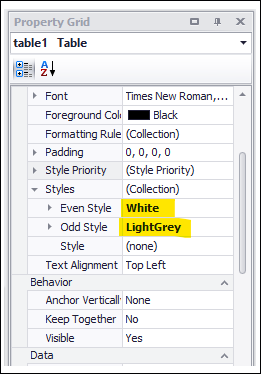
In the Property Grid, with your table selected, set the Even and Odd style options to your corresponding even and odd styles:
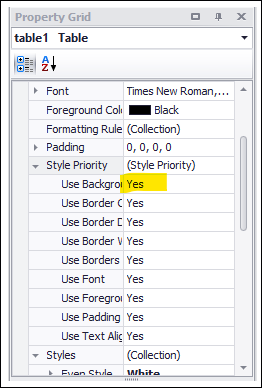
The Style Priority option will need to have Use Background set to Yes for this to work.
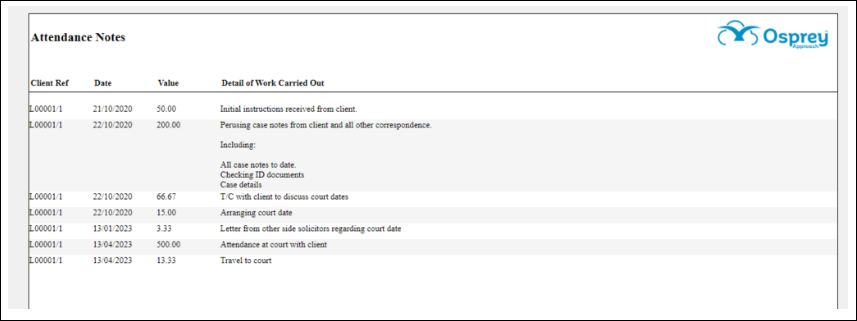
When run, your report will now have alternating grey and white rows: